The User Interface
When opening OpenDSS, the user is greeted with the following window:
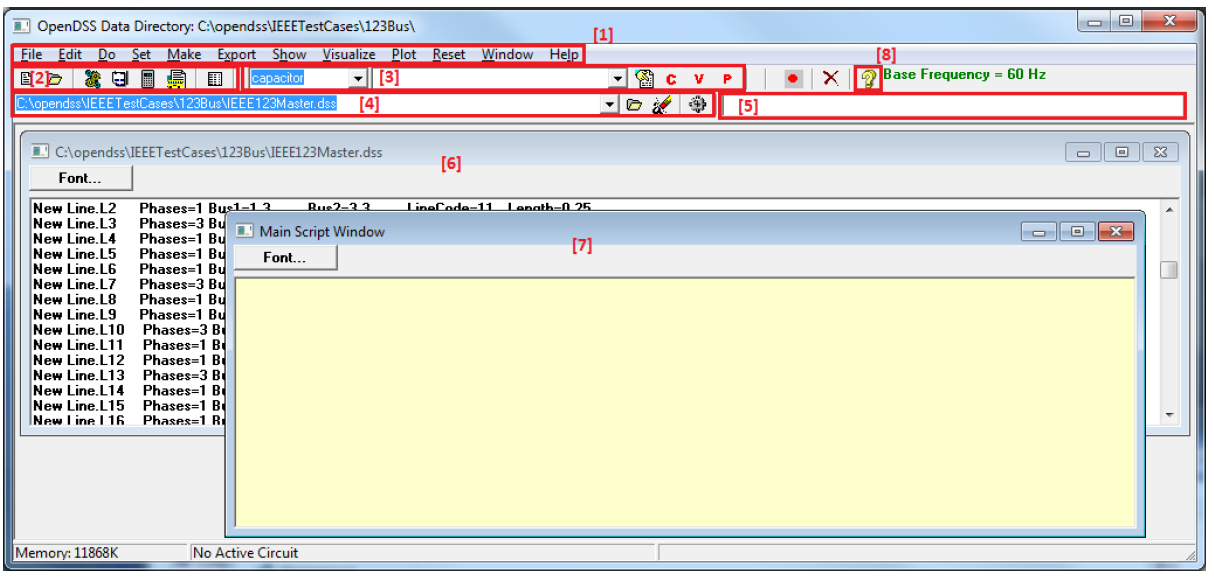
Key components of the interface include,
1. The menu structure, which drives most of the workflow in OpenDSS. Menus of interest
include:
- The Set menu, which allows one to set any solution parameter that can be set via the options scripting command.
- The Export menu, which allows one to save various reports to csv files.
- The Show menu, which contains much of the same information as the reports as the Export menu, but displays them directly in the GUI.
- The Visualize menu, which provides a graphical output of the device selected via the element selector (item 3 in the figure).
- The Plot menu, which provides graphical output relevant to the whole system.
2. The toolbar, which provides direct access to many commonly used OpenDSS commands such as “Solve,” “Summary,” and “Do Command.”
3. The element tools, which allows the user to select what circuit element (by type) to edit or display visualizations for.
4. The script tools, which allows one to select which of the current opened scripts to run.
5. The results bar, which provides a condensed version of the Results window which can be accessed through Show > Result Form.
6. Script Windows to directly edit various *.dss files
7. The Main Script Window is a sort of “notepad” or “interactive window” for OpenDSS. The user can type small commands and run them via the “Do Command” feature (Ctrl‐ + D). The contents of this window are retained between sessions.
8. The Help button which brings up the OpenDSS Command and Element Properties Reference which gives a tree-view guide to the various script commands in OpenDSS.