Behavior of the model
The model typically converges in 5 iterations (tolerance 0.5%); however, this behavior can change depending on the tolerance programmed by the user when declaring the UPFC. Figures 6 and 7 shows the evolution of the voltage and PF until reach convergence (tol1=0.02).
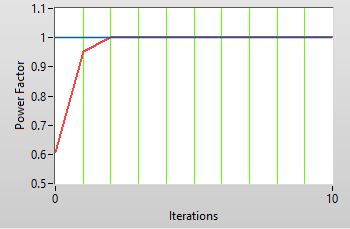

Figure 6. a) Voltage evolution until reach convergence (set point 240 V) b) Power factor evolution until reach convergence (Set point PF=1.0)
Figures 7 to 13 show the voltage and power factor values obtained as functions of the voltage incoming to the UPFC when simulating in OpenDSS. In these tests the property VpqMax=24.
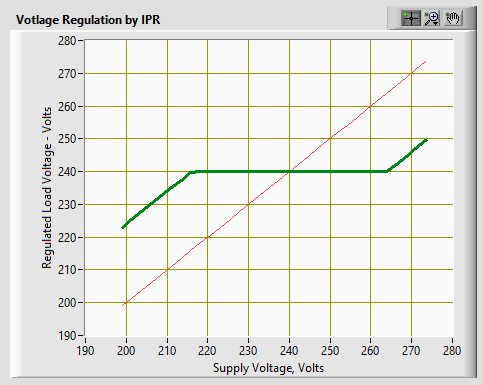
Figure 7. Voltage regulated as a function of the input voltage (set point 240 V)

Figure 8. Voltage regulated as a function of the input voltage (set point 216 V)
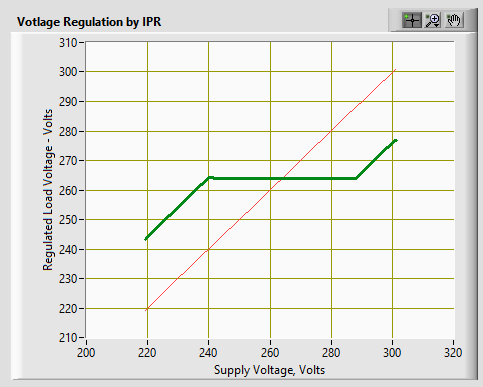
Figure 9. Voltage regulated as a function of the input voltage (set point 264 V)
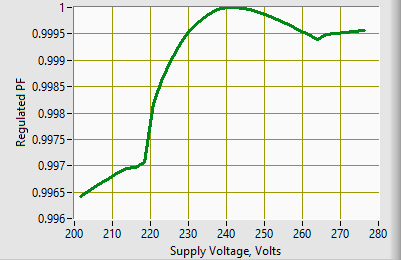
Figure 10. Compensated reactive power (set point PF=1)

Figure 11. Compensated reactive power (set point PF=0.9)

Figure 12. Compensated reactive power (set point PF=0.8)

Figure 13. Losses obtained for a 50kW load