Enabling/Disabling a specific parameter
As mentioned earlier, Figure 2 shows the inverter capability curve resulting from the use of all possible properties. To generate simpler curves, OpenDSS allows some of the properties to be disabled. Figure 3 describes possible modifications to the capability curve by enabling/disabling the %PminNoVars, %PminkvarLimit and varFollowInverter. For simplicity, the resulting capability curve is shown for operation in first quadrant only (the disabling of any parameter also affects the capability curve in the other quadrants). Note that %CutOut and varFollowInverter can also be disabled.
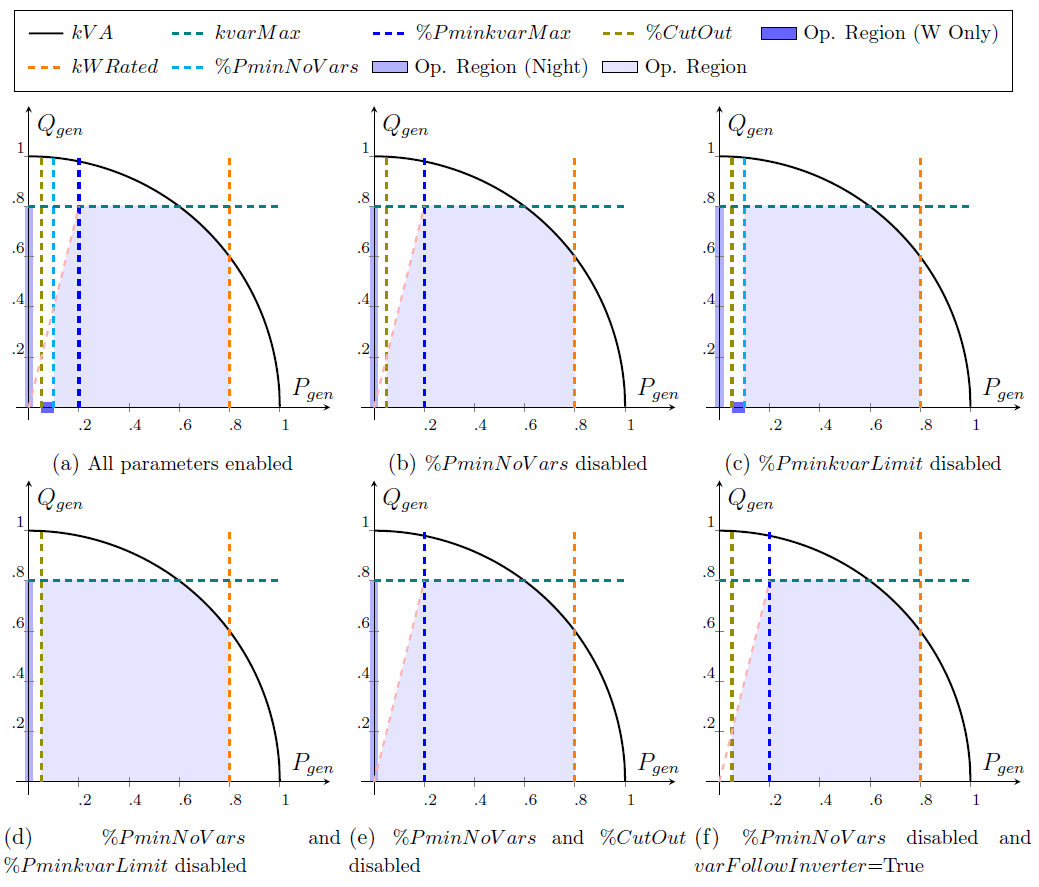
Figure 3: Possible Shapes for Inverter Capability Curve