Operating conditions properties
The irradiance and temperature on the PV array are the data that define the operating condition.
Irradiance: The properties to define the irradiance for a time duration are:
- irradiance: Base value of irradiance in kW/m2 for QSTS simulations and present irradiance value for static simulations;
- yearly or daily or duty : yearly, daily or duty irradiance curves, respectively. These curves are defined in pu of the value defined in the irradiance property. To define this curve in OpenDSS, Figure 4, you must use the LoadShape object, as shown below.
New Loadshape.I rrad npts=24 i n t e r v a l =1
~ mult=[0 0 0 0 0 0 . 1 . 2 . 3 . 5 . 8 . 9 1 . 0 1 . 0 . 9 9 . 9 . 7 . 4 . 1 0 0 0 0 0 ]
- temperature: Present temperature on the PV array. This property is used only for static simulations, while Tshape is used for QSTS simulations;
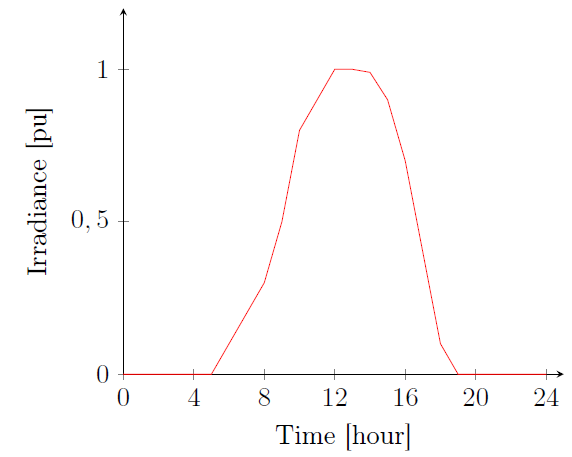
Figure 4: Daily irradiance curve
- Tshape: Temperature curve for a time duration, in C, on the PV array. To define this curve in OpenDSS, the user must use the Tshape object, as shown below.
New Tshape . Temp npts=24 i n t e r v a l =1
~ temp=[25 25 25 25 25 25 25 25 35 40 45 50 60 60 55 40 35 30 25 25 25 25 25 2 5 ]
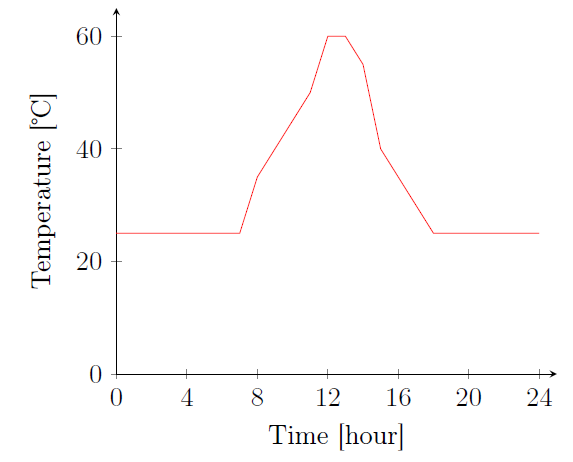
Figure 5: Daily temperature curve