PlotCircuit
With this command the user can plot the model’s schematic on top of the map. OpenDSS-GIS will zoom in the map to display the entire model. The schematic draw will follow the features set when assigning values to options GISColor and GISThickness. By default, GISColor ir red (FF0000) and GISThickness is 3. Consider the model proposed in Figure 25.
GIS PlotCircuit
After executing GISPlotCircuit the model schematic will be display in OpenDSS-GIS as shown at Figure 25
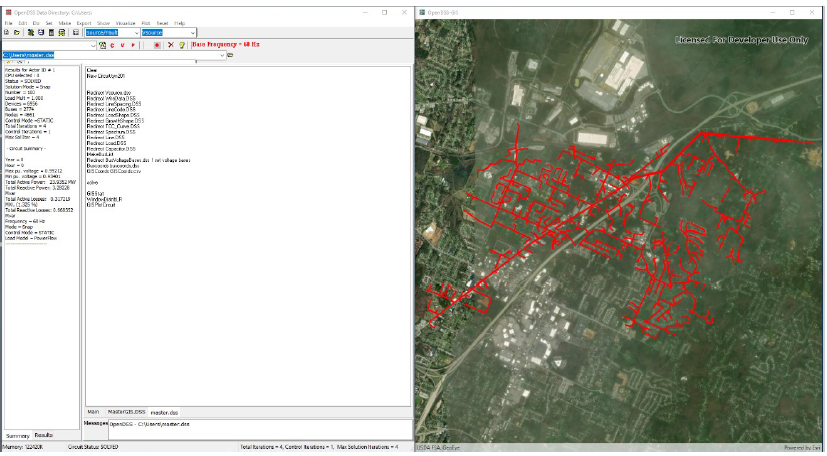
Figure 25. Plotting circuit model in OpenDSS-GIS
Now, suppose you want to change the circuit line color to blue and make the model thinner, set GISColor = 0000FF (blue) and GISThickness = 1. The output will be as shown at Figure 26.
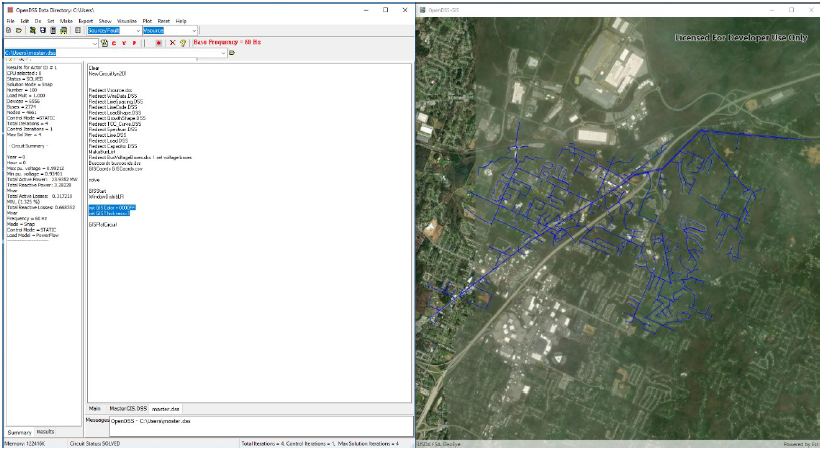
Figure 26. changing the default settings for plotting the circuit diagram in the map