The losses curve
The losses curve of the UPFC is a XY curve where the losses are defined as a function of the input voltage. The values for the voltage (X) must be specified in pu and the values for the power (Y) must be specified in percentage. In the case of the power, the quantities must be specified considering the base power, this is, suppose that the load power is 50kW and the desired losses at 0.9 Vpu are the 1%, in this case, the couple of values will be 0.9 (X) and 1.01 (Y). For example, consider the losses curve shown in Figure 2. This curve corresponds to the losses of the UPFC when connected to a load of 50kW.
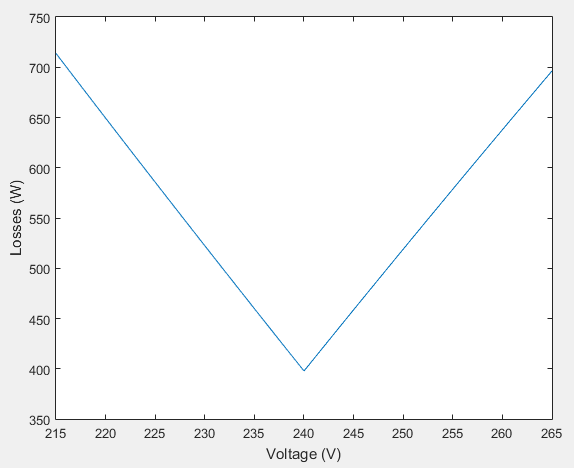
Figure 2. Losses curve for the UPFC with a 50kW load connected (example)
In Figure 2, the minimum value of losses is 397.76W and the maximum 713.76W, both values correspond to the 0.8% and 1.43% of the load. In this case, the XY curve object must be defined I OpenDSS as follows:
New XYCurve.UPFCLoss npts=3 xarray=[0.9 1 1.1] yarray=[1.0143 1.008 1.0143]