Workflow
In general, the user will want to:
1. Define the circuit they wish to study by creating new lines, transformers, loads, generators, etc…
a. Realistically, the best way to do this is by creating a dss script. More details on scripting are provided in the Basics of the OpenDSS Scripting Language section.
b. Once a script has been written, use the button to run the selected script.
2. Set up the circuit options, such as the solution mode (snapshot, daily, harmonic, etc…)
a. This is accomplished through the commands in the Set menu. The most basic form of analysis is the “snapshot” which is analogous to a traditional power flow. For additional information on circuit options, see the Circuit Model Concept.
3. Solve the powerflow problem
a. First, ensure that the bus list is created and the base voltages found by running Do > Calc Voltage Bases.
b. Then use the  button in the toolbar to solve the circuit.
4. Perform analysis on the solved circuit – The specifics of how to accomplish this vary from analysis to analysis, but some general tasks include:
a. Looking at a branch, transformer, load, or other element in the system – To do this, first select the element type and then the element from the element toolbar. Then select the C, V, or P buttons to see a current, voltage, or power visualization. Select the  button to edit the element. An example of a voltage visualization for a line is provided in Figure 1.

Figure 1. Voltage Visualization for a Line Element
b. Visualize the voltage profile of the system – Type plot profile into the main script window, and press Ctrl‐D to Do that command. A voltage profile will come up showing how the voltage progresses as one progresses down the feeder; an example is provided in Figure 2. Additional parameter can be specified via the plot command; see the plot section of this manual.
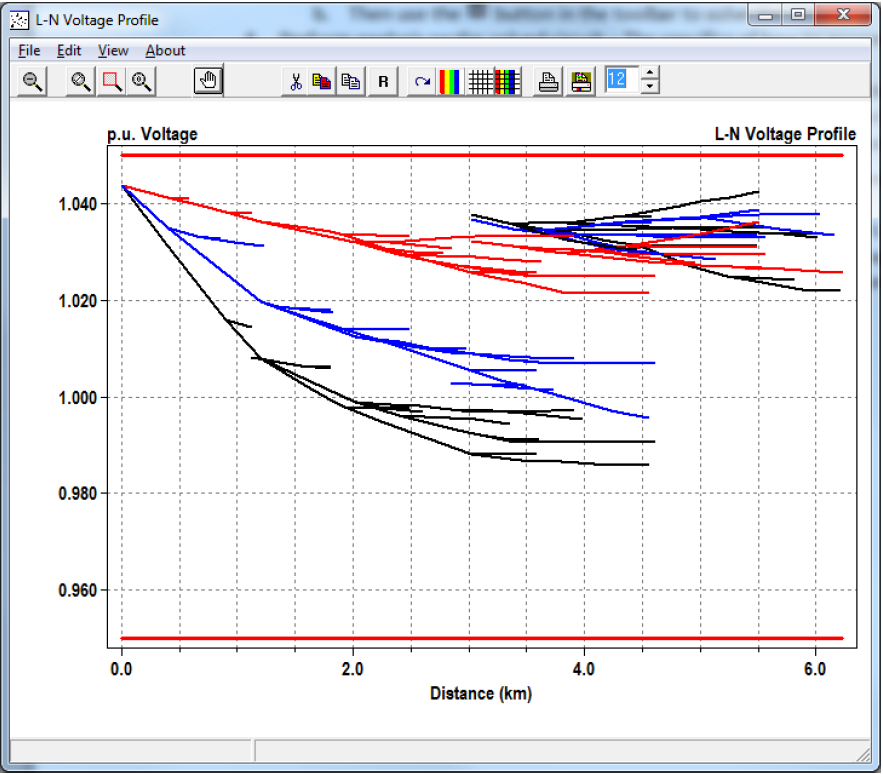
Figure 2. Voltage Profile for a Feeder
c. Visualize data onto a one‐line of the feeder – If you provide bus location data via the buscoords command (see the plot menu commands section for more information), you can superimpose power flow data onto a map/one‐line of the system. To do this, go Plot > Circuit Plots > Circuit Plot. An example is provided in Figure 3. Additional parameter cans be specified via the plot command.
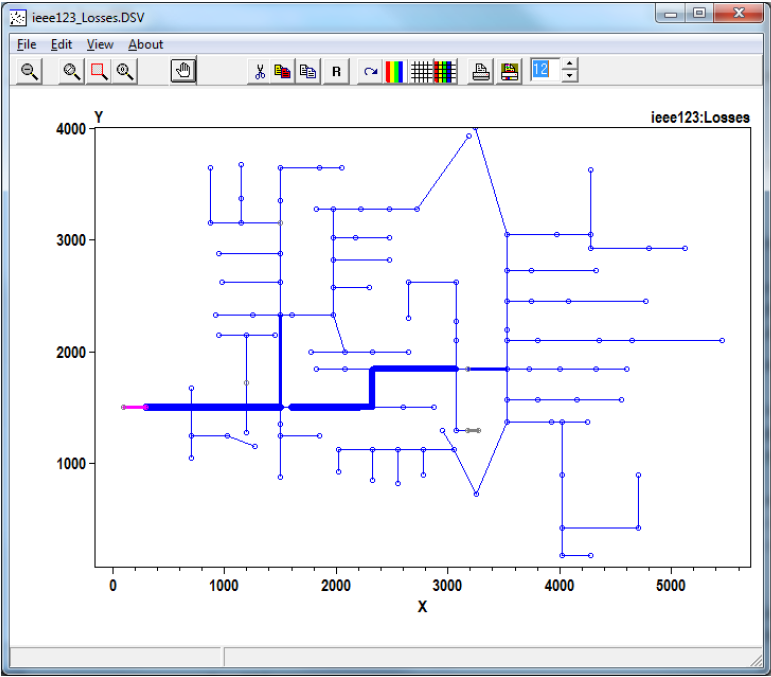
Figure 3. Lines Losses for a Feeder
d. Export data for analysis in 3rd party program – All results obtained through OpenDSS can be exported through the various commands in the “Export” menu. Results are .csv files (see the export section for more information)