TechNote Plot Profile
A new type has been added to the Plot command:
Plot [type=]Profile
This plot is designed to show the voltage profile along the feeder. It plots selected voltages vs distance from the substation (actually Energymeter object upline from the bus). It requires an EnergyMeter object, which should be placed at the head of a feeder.
The command uses the "Phases" property of the Plot command to determine which voltages to plot.
The following are examples for the IEEE 8500node test feeder (unbalanced).
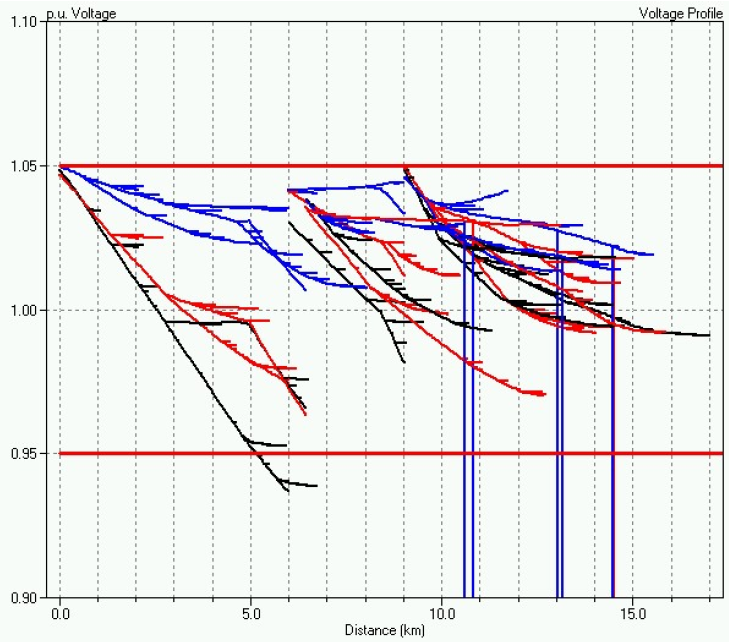
The Default
Plot Profile [phases=default]
This form of the command plots only phases 1, 2, or 3 of buses having at least 3 phases.

Primary Only
Plot Profile Phases=primary
Plots only voltages at buses where the kV base is greater than 1 kV. This picks up some 1phase buses and nodes that are isolated through open switches (zero voltage)
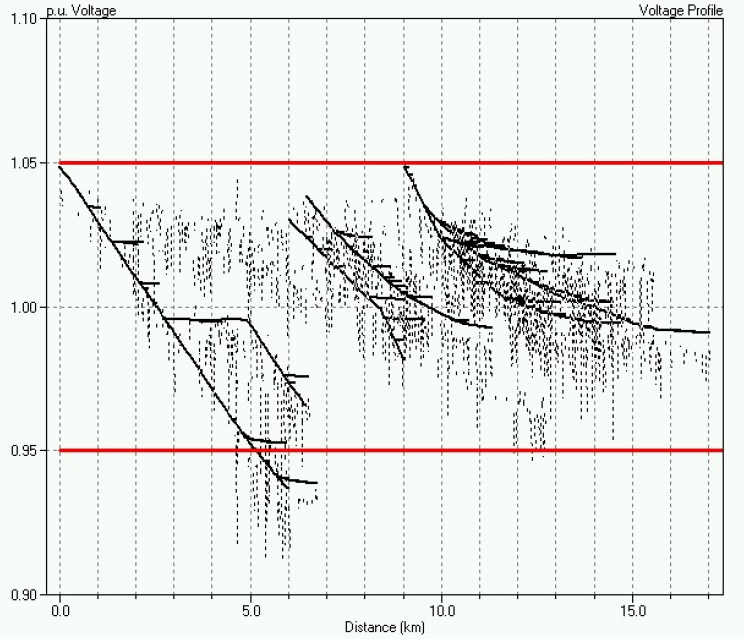
All Nodes
Plot Profile Phases=all
Plots all node voltages. Secondaries are shown with dashed lines and usually appear nearly vertical on this scale. The secondaries are generally short so that the lines are nearly vertical. This clearly shows the voltage drop across the secondary service drop.
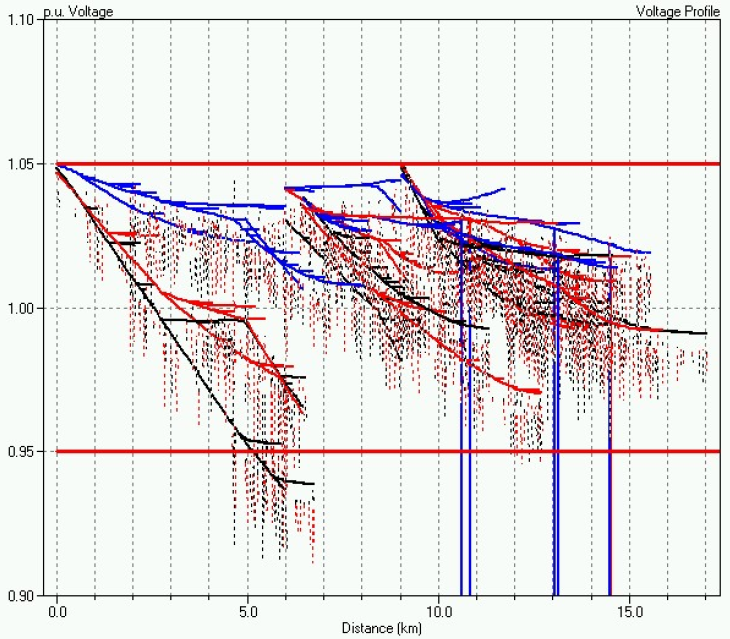
One Phase Only
Plot Profile Phases=1
Plots only those voltages at nodes designated as "1". (This shows some secondaries that are actually connected to other primary phases, but are designated as phase 1. Note that you may designate the secondary node numbers to match the primary node numbers if your want this to look differently.)