TechNote Using the Daisy Plot
The Daisy Plot
This plot option was named the "daisy" plot because of the shapes it generates when more than one object exists at a bus.
A daisy plot is a circuit plot with yellow circles -- with a stem -- plotted around selected buses. By default, the circles represent Generator locations and are useful for display generator locations after executing Solve in AutoAdd mode when adding generators. After the solution, the user can visually combine the results of the siting algorithm. Alternatively, you may create an arbitrary list of bus names (Buslist property of the Plot command) that
represents whatever you wish.
Like other circuit plots, the coordinates of the buses must be previously defined.
Three examples of the basic syntax are:
Plot type=daisy quantity=power max=5000 ! plots generator locations on Power plot
Plot type=daisy quantity=power max=5000 buslist=[mybus1, mybus2, ...]! plots a daisy at selected bus ~locations
Plot type=daisy quantity=power max=5000 buslist=[file=MyBusList.txt]! plots a daisy at selected bus ~locations
An example from the OpenDSS version of the IEEE 8500Node test case is shown below:
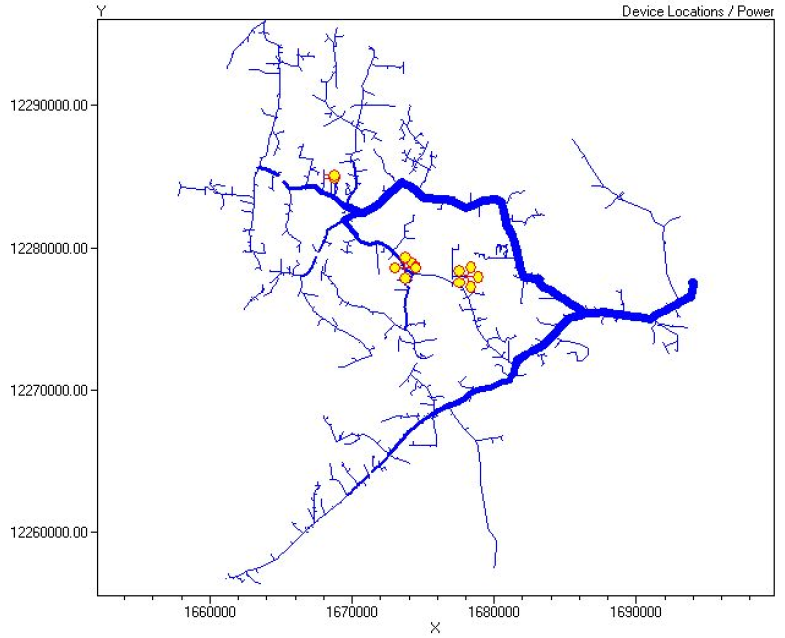
This was generated from the following script:
Set DaisySize=2
plot daisy power max=2000 dots=n buslist=(file=daisybuslist.txt )
Where the contents of daisybuslist.txt were:
"l3216367"
"m1069464"
"p873787"
"p873787"
"p873787"
"p873787"
"l2897768"
"l2897768"
"l2897768" Text on this side of the bus name is ignored
"l2897768"
"l2897768"
"l3649301"
"l3649302"
Notes:
1. The quotes are not required if there are no blanks or special character in the bus names. These bus names were extracted from the "Show Buses" command.
2. To obtain a "daisy" simply repeat the bus name as many times as desired
3. Text on the line to the right of the bus name is ignored.
4. Note that in this example the Set DaisySize=... option was used to double the default size of the daisies.