Precedence of Watt Related Functions/Settings
This example illustrates the precedence of watt related functions and the violation of the element’s kWRated limit. The following script has been utilized.
...
!kW Rated Violation Only
New LoadShape.dispatchFollow interval=1 npts=24 mult=[0,0.01,0.08,0.12,0.16,0.30,0.85,0.96,1.05,1.05,0,0,0,0,0.01,0.08,0.12,0.16,0.30,0.85,0.96,1.05,0,0]
Edit Storage.A dispmode=follow daily=dispatchFollow kvar=200
!VWCurves
!VWCurve for Discharging
New XYCurve.vwcurvedch npts=4 yarray=[1 1 0.0 0.0] xarray=[1 1.05 1.1 1.3]
!VWCurveforCharging
New XYCurve.vwcurvech npts=4 yarray=[0.0 0.0 1 1] xarray=[0.7 0.9 0.95 1]
New InvControl.InvCtrl mode=VOLTWATT voltWattcurve=vwcurvedch
~ voltWattCHcurve=vwcurvech
!PPriority
Set casename=Ppriority
Edit Storage.Awattpriority=true
!QPriority
!Setcasename=Qpriority
!EditStorage.Awattpriority=false
!PFPriority
!Setcasename=PFpriority
!EditStorage.APFpriority=true
Set mode=Daily
Set maxcontroliter=50 Setstepsize=1h
!15am
Edit VSource.sourcepu=1.02
Set number=5
Solve
!6am
Edit VSource.sourcepu=0.94
Set number=1
Solve
!7am
Edit VSource.sourcepu=0.95
Solve
!8am
Edit VSource.sourcepu=0.982
Edit Storage2.A %kWRated=88
Solve
!9am
Edit VSource.source pu=1.0
Edit Storage2.A %kWRated=100
Solve
!10am7pm
Edit VSource.source pu=1.02
Set number=10
Solve
!8pm
Edit VSource.source pu=1.025
Set number=1
Solve
!9pm
Edit VSource.source pu=0.98
Edit Storage2.A %kWRated=88
Solve
!10pm
Edit VSource.source pu=0.97
Edit Storage.A %kWRated=100
Solve
!11pm12am
Edit VSource.source pu=1.02
Set number=2
Solve
Export monitors MonStorageAState
Export monitors MonStorageAV
Export eventlog
Similarly to the previous example, the storage element is operated with active power dispatch driven by “Follow” mode, however the reactive power dispatch is set to constant kvar mode, with 200 kvar of reactive power generation. Futhermore, the actual active power dispatch may be limited by the smart inverter VW functionality, which is specified in “InvCtrl” InvControl control element. Note that two different Volt-Watt curves (XYCurve object) have been specified. One for operation in discharging state and the other for operation in charging state, as shown in Figure 7.
The daily simulation is broken in several time intervals with varying sizes (specified through property number). The voltage magnitude of the voltage source (pu property) is also varied in the simulation. This has been done to force the operation of the VW function in selected time instants to highlight the precedence of functions.
Note that there are 3 different inverter functions from Table 1 being applied in this example:
- Volt-Watt Function (3rd priority): enabled by the InvControl control element;
- Limit DER Power Function (3rd priority): enabled by setting %kWRated to a value less than 100, which is done at 8am and 9pm only;
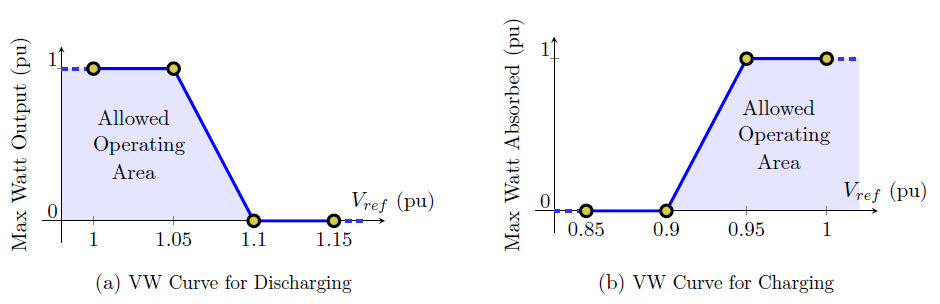
Figure 7: Volt-Watt Curve for Discharging (a) and Charging (b)
- Storage “Follow” Dispatch Mode (5th priority): enabled when setting dispmode = follow;
Figure 8 shows the PQ plane with all operating points for each of the priorities. Note that all operating points lie on the constant power factor line (except for those that fall in the Watts only region) and that there are no differences in the inverter response between all three priorities for the kWRated violation, as expected, according to Figure 4b.
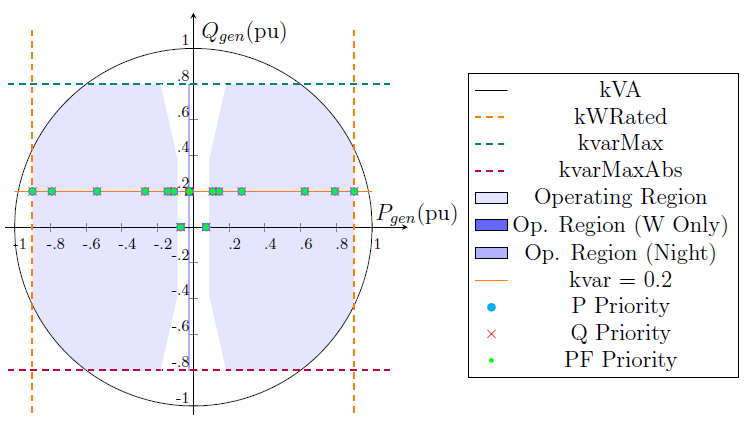
Figure 8: PQ Plane with Inverter Capability Curve and Operating Points under Constant kvar Mode (Example 11.2)
A few rows and columns of the .csv file exported from monitor Mon StorageA State are shown in Table 4. For a complete description of each column, see [3].
At 6am, the kW desired by the “follow” dispatch mode to charge the element is 270kW, and the average voltage (see InvControl’s monV oltageCalc property) applied at the element’s terminal is 0.9357, which lies within the region where the VW curve for charging tries to limit the active power. The limit imposed can be calculated as (0.9357 − 0.9) × 1 × 900 = 642.6kW , which is greater than the desired output. Thus, the power that charges the element at the grid interface, kWIn, is 270kW .
At 7am, the desired power is 765kW. However, the voltage reference to the VW is 0.9299, which leads to a limit imposed by this function of (0.92994 − 0.9) × 1 × 900 = 538.9kW . Since %kWRated at this time instant is 100%, the limit imposed by the Limit DER Power Function is 900kW. Thus, as the limit imposed by the VW function requires the greatest reduction and it has a greater priority than the power desired by the “follow” dispatch function, it takes precedence and the actual power with which the element is charged is 538.9kW.
At 8am, %kWRated has been set to limit the output in 88 percent of the rated active power, which is 792kW. Note that the voltage reference for the VW function is 0.9477, which means the limit of (0.9477 − 0.9) × 1/0.05 × 900 = 858.6kW . However, the controller has access to the limit imposed by the Limit DER Power Function, and thus, the power reported in “kW VW Limit” is the lowest between the power calculated from the VW curve and the one imposed by the direct command. As the desired power at this time instant is higher than the limit imposed by %kWRated, the actual power output that charges the element at the grid interface is 792kW .
At 9am, the power desired is 1.05 × 900 = 945kW . As none of the limiting functions impose a lower limit, the actual power at the grid interface is limited by the nameplate device setting, kWRated (2nd priority).
Finally, at 10am, there is not enough energy capacity left to keep charging the element, which corresponds to a Fundamental Physical Limit (1st priority). Therefore, the element enters in idling state, charging only enough power to sustain its idling and associated inverter losses. Note that because there is no energy capacity left, kWDesired shows 0, even though the loadshape multiplier at 10am is -1.05.
Table 4: Selected Rows and Columns of csv File Exported from Monitor Mon StorageA State
|
Hour |
State |
kWOut |
kWIn |
kvarOut |
Inv ON |
Vref |
VW Oper |
kW Desired |
kW VW Limit |
Limit kWOut Function |
|
1 |
0 |
0 |
21.8 |
200 |
0 |
1.0290 |
0 |
0 |
9999 |
900 |
|
2 |
0 |
0 |
21.8 |
200 |
0 |
1.0290 |
0 |
-9 |
9999 |
900 |
|
3 |
-1 |
0 |
72 |
0 |
1 |
1.0163 |
0 |
-72 |
900 |
900 |
|
4 |
-1 |
0 |
108 |
200 |
1 |
1.0246 |
0 |
-108 |
900 |
900 |
|
5 |
-1 |
0 |
144 |
200 |
1 |
1.0227 |
0 |
-144 |
900 |
900 |
|
6 |
-1 |
0 |
270 |
200 |
1 |
0.9357 |
0 |
-270 |
642.6 |
900 |
|
7 |
-1 |
0 |
538.9 |
200 |
1 |
0.9299 |
1 |
-765 |
538.9 |
900 |
|
8 |
-1 |
0 |
792 |
200 |
1 |
0.9477 |
0 |
-864 |
792 |
792 |
|
9 |
-1 |
0 |
900 |
200 |
1 |
0.9599 |
0 |
-945 |
900 |
900 |
|
10 |
0 |
0 |
22.0 |
200 |
0 |
1.0290 |
0 |
0 |
9999 |
900 |
|
11 |
0 |
0 |
21.8 |
200 |
0 |
1.0290 |
0 |
0 |
9999 |
900 |
|
12 |
0 |
0 |
21.8 |
200 |
0 |
1.0290 |
0 |
0 |
9999 |
900 |